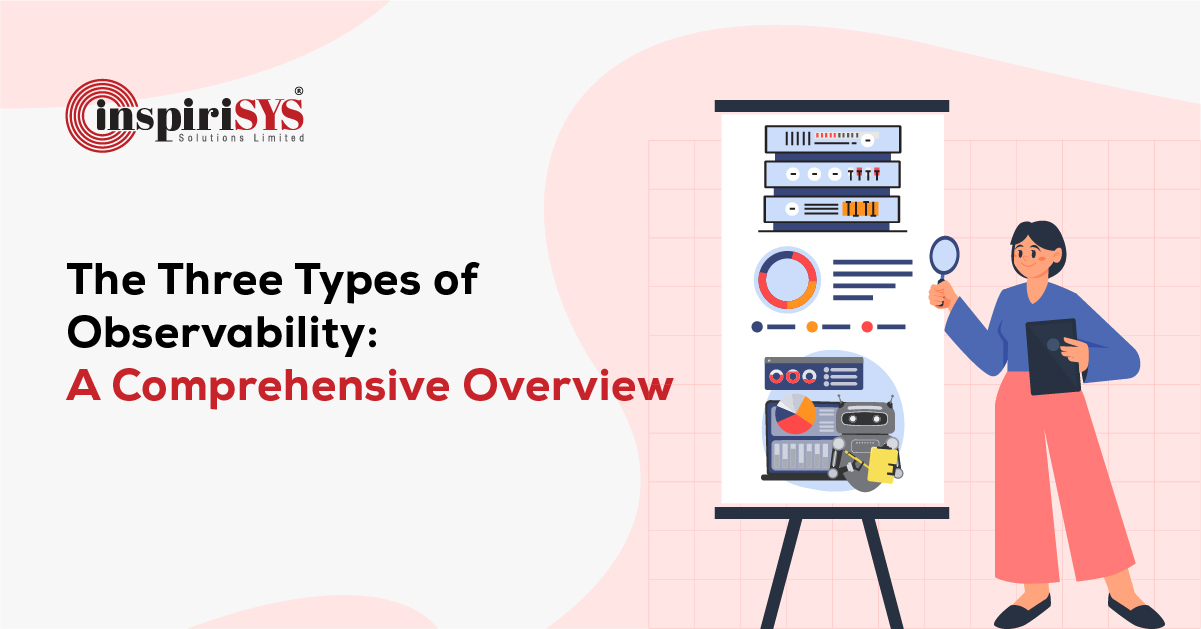
Quick Summary: Observability is a proactive method to identify and address issues at their core, enhancing the reliability and performance of IT systems. In this article, we will explore the concept of observability, examining its three types, benefits, and challenges, supplemented by real-time examples for a clearer understanding.
What is Observability?
O Understanding observability is akin to a routine health check-up for your software system. Just as a doctor examines vital signs, blood tests, and diagnostic tools to assess a patient's health, observability involves collecting and analyzing logs, metrics, and traces to evaluate the well-being of your software.
In other words, observability refers to the degree to which you can deduce the inner workings or status of a complex system solely by examining its external results. The higher the level of observability a system possesses, the more swiftly and precisely you can trace the origins of a performance issue once it's identified, without requiring additional testing or coding.
This article discusses the three types of observability - infrastructure, data, and machine learning. It covers critical components, tools, and real-time examples. These terms are not unique to our technical personas like DevOps teams, data engineers and MLOps engineers. In this article we will discuss what Observability means to all these engineers.
-
Infrastructure or System Observability (Full-stack visibility inside infrastructure)
This observability primarily focuses on latency, failure, and resource utilization. It entails measuring the real-time state of an IT environment through data generated in the form of logs, metrics, and traces. By collecting and analysing these data points, it provides insights into the system's performance, health, and behaviour, enabling informed decision-making and troubleshooting.
Software engineers possess the capability to efficiently monitor distributed IT systems, granting them full-stack visibility into the infrastructure. This proficiency enables them to identify cascading effects within complex systems and conduct root cause analysis with the utmost precision.
Key Components of Infrastructure Observability
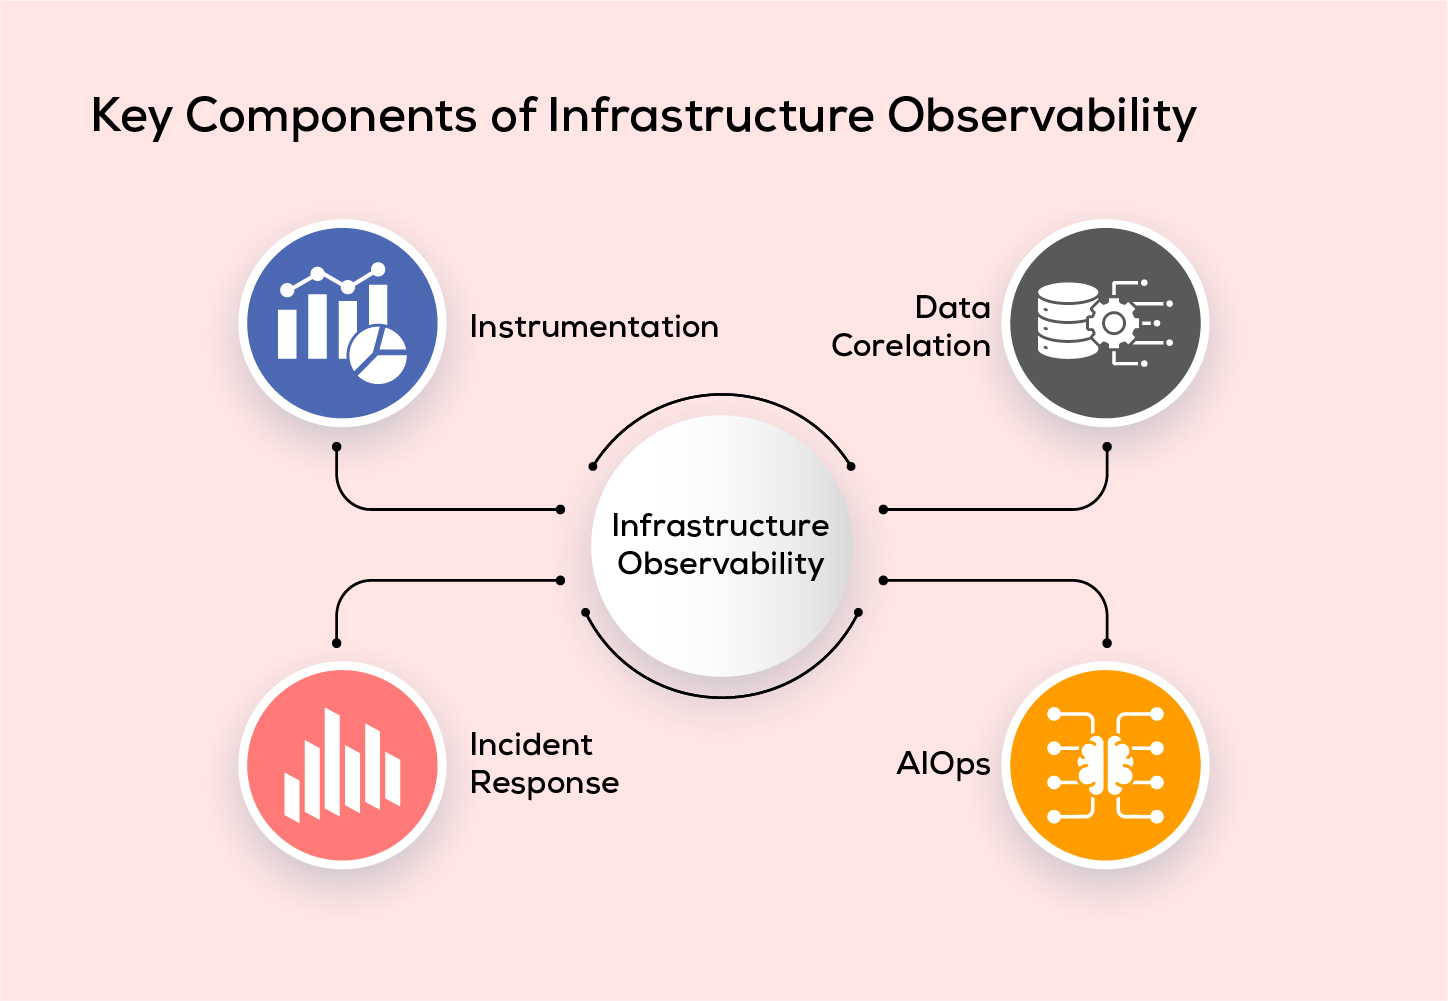
Instrumentation:
Instrumentation lays as a foundation step for observability. This component refers to the use of specialized measuring tools or software components that enable you to gather telemetry data from various sources within an IT environment. These sources can include containers, services, applications, hosts, pods, and more. It is essential in providing valuable insights that are crucial for monitoring, troubleshooting, and optimizing your infrastructure.
Data Corelation:
This component helps in connecting the dots from the telemetry data to identify patterns, trends and potential relationships in the IT ecosystem. This correlation is essential in diagnosing the issues and make informed decisions. By facilitating automated data curation and streamlining the process of organizing and visualising time series data, it becomes easy to scrutinise the performance history of the system.
Incident Response:
This is a key aspect in managing IT systems. It delivers the timely information regarding data outages. This demands technical skills and expertise from the incident resolution team.
IAIOps:
AIOps, using Artificial Intelligence and Mahine Learning, enhances IT system management by prioritizing critical issues, reducing alert noise, and detecting performance issues for better reliability and efficiency.
Merits of Infrastructure Observability
- Gain Better Visibility into IT Infrastructure
- Accelerate Developer Velocity
- Streamline Application Workflow
- Detect Problems Faster
- Achieve Pinpoint Accuracy in Root Cause Analysis
- Enhance User Experience
Challenges in Infrastructure Observability
- Coping with the intricacies of dynamic cloud environments.
- Managing the sheer volume, speed, and diversity of alerts.
- Real-time monitoring of microservices and containers.
- Assessing the business impact of observability.
Best Practices of Infrastructure Observability
- Monitoring critical components.
- Tailoring graphs to meet specific customer requirements.
- Filtering data at its source.
- Prioritizing data aggregation and centralization.
- Establishing an efficient feedback loop mechanism.
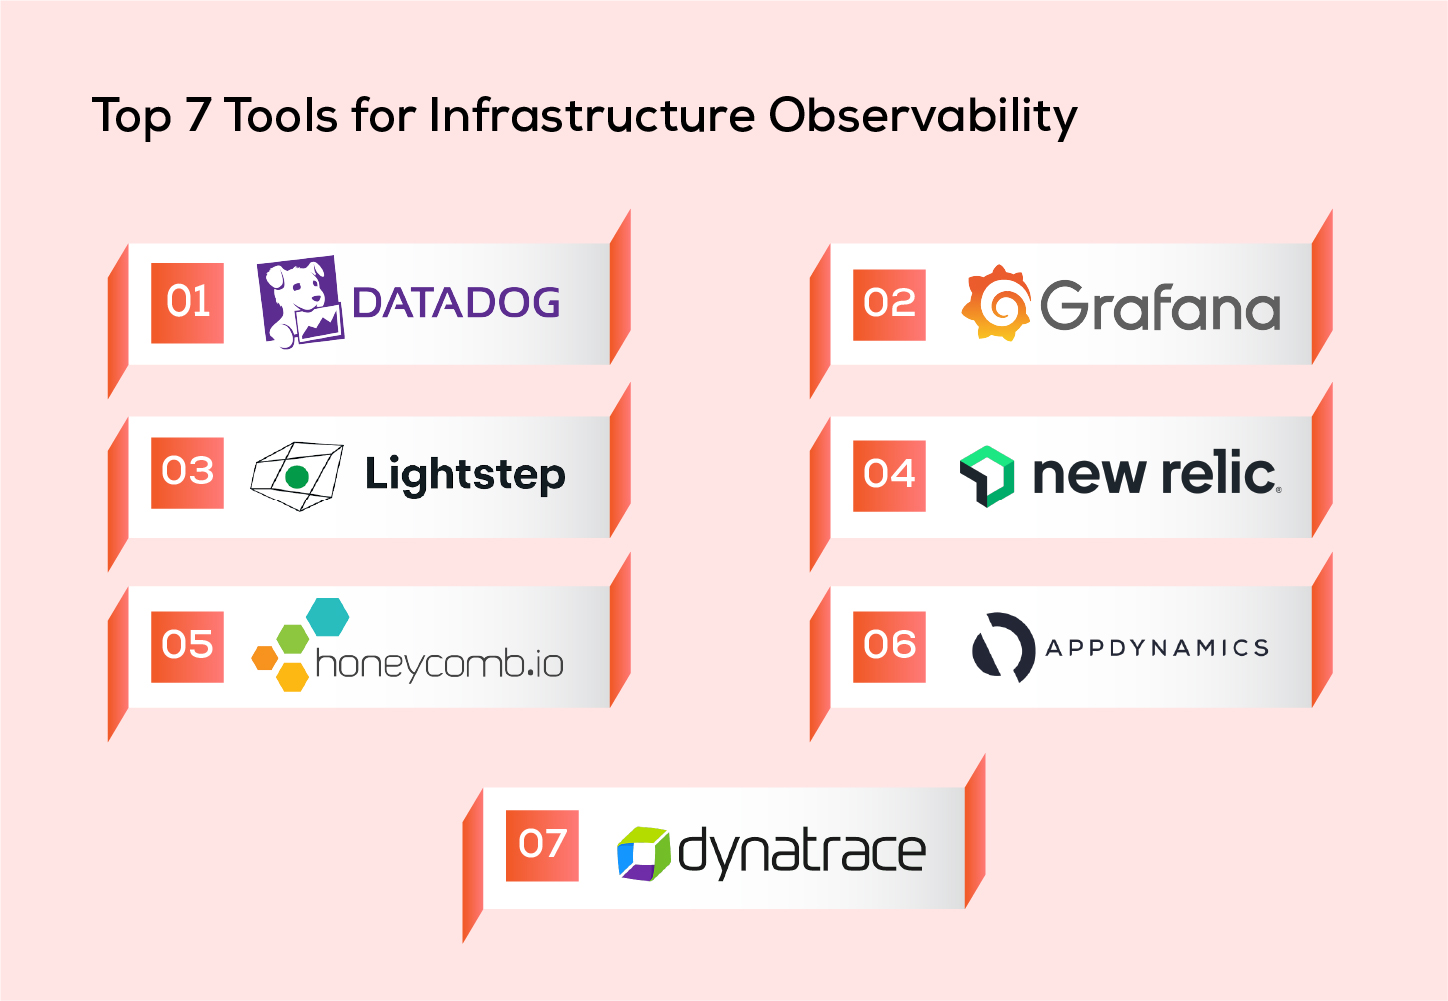
Top 7 Tools for Infrastructure Observability
-
Data Observability (Full-stack visibility inside data pipelines)
The data observability solutions leverage automated monitoring and alerting systems to continuously evaluate the quality of data and pinpoint any discoverability issues that may arise throughout the data's lifecycle. This proactive approach ensures that the data pipelines remain in optimal health, making them reliable and robust. Moreover, it enhances the efficiency of data and analytics teams, as they can confidently work with high-quality data, and it ultimately leads to satisfied customers who benefit from the improved data-driven insights and services.
Key Components of Data Observability
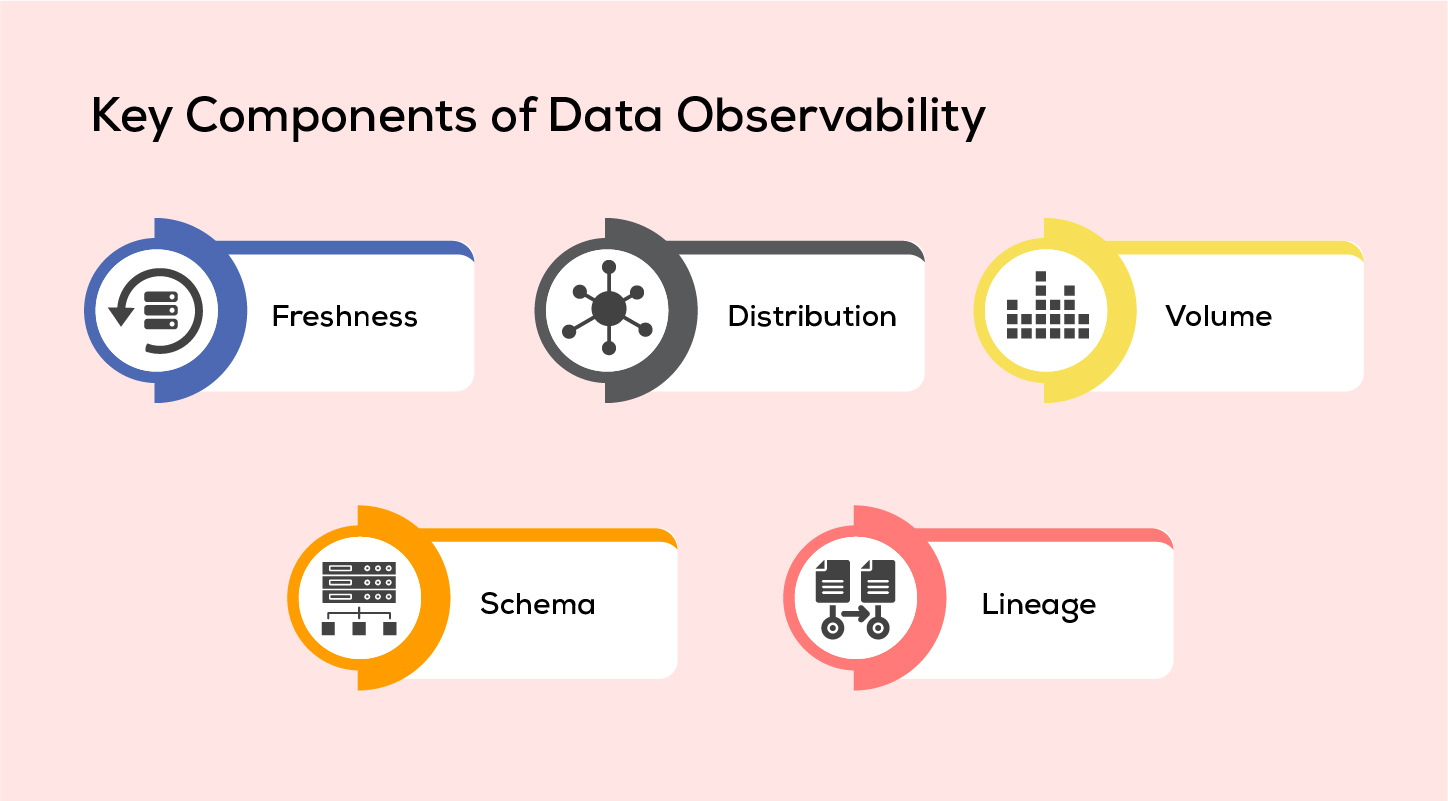
Freshness:
Keeping the data up-to-date can prove to be one of the most challenging tasks in today’s modern IT systems. Fresh data enables in better decision-making.
Distribution:
After having a fresh data, next step is data distribution. Data accuracy is the most essential element when it comes to reliability. Data distribution provides insights into the system's data variability. Excessive variance indicates potential accuracy issues. This aspect of data distribution centres on evaluating the quality and consistency of data generated and consumed by the system.
Volume:
The data volume seeks to address whether incoming data adheres to predefined threshold limits or if sufficient storage capacity is available to accommodate the data needs. Maintaining ongoing vigilance over data volume guarantees that data requirements remain within established boundaries.
Schema:
As an organization expands and new features are incorporated into its application database, the database schema, which defines the structure of the database, may need to be altered. The schema serves as a blueprint for organizing data, specifying the arrangement of data tables, the attributes of fields, and the names of columns.
Lineage:
Lineage refers to the ability to trace and understand how data flows through various components and systems in our organization. It involves tracking the origin, transformations, and destinations of data. To fully grasp the data ecosystem, you need to consider four key aspects or "pillars." These pillars represent different elements of data management, such as data quality, data governance, data integration, and data security.
Merits of Data Observability
- Identify data problems proactively, preventing business impacts.
- Guarantee the prompt delivery of high-quality data.
- Speed up time-to-market.
- Enhance operational efficiency.
- Foster better cooperation among data engineers.
- Maintain data consistency in IT systems.
Challenges in Data Observability
- Sustained data volume growth accompanying business expansion.
- The intricacy of data pipelines that undergo frequent alterations.
- The dismantling of data silos within IT systems.
- The integration of all systems throughout the organization.
- The need for standardizing data from various sources.
Best Practices of Data Observability
- Gather real-time data from diverse sources whenever feasible.
- Incorporate data monitoring solutions into all workflows.
- Activate data logging as needed.
- Provide actionable data insights to stakeholders.
- Implement automated remediation systems when applicable.
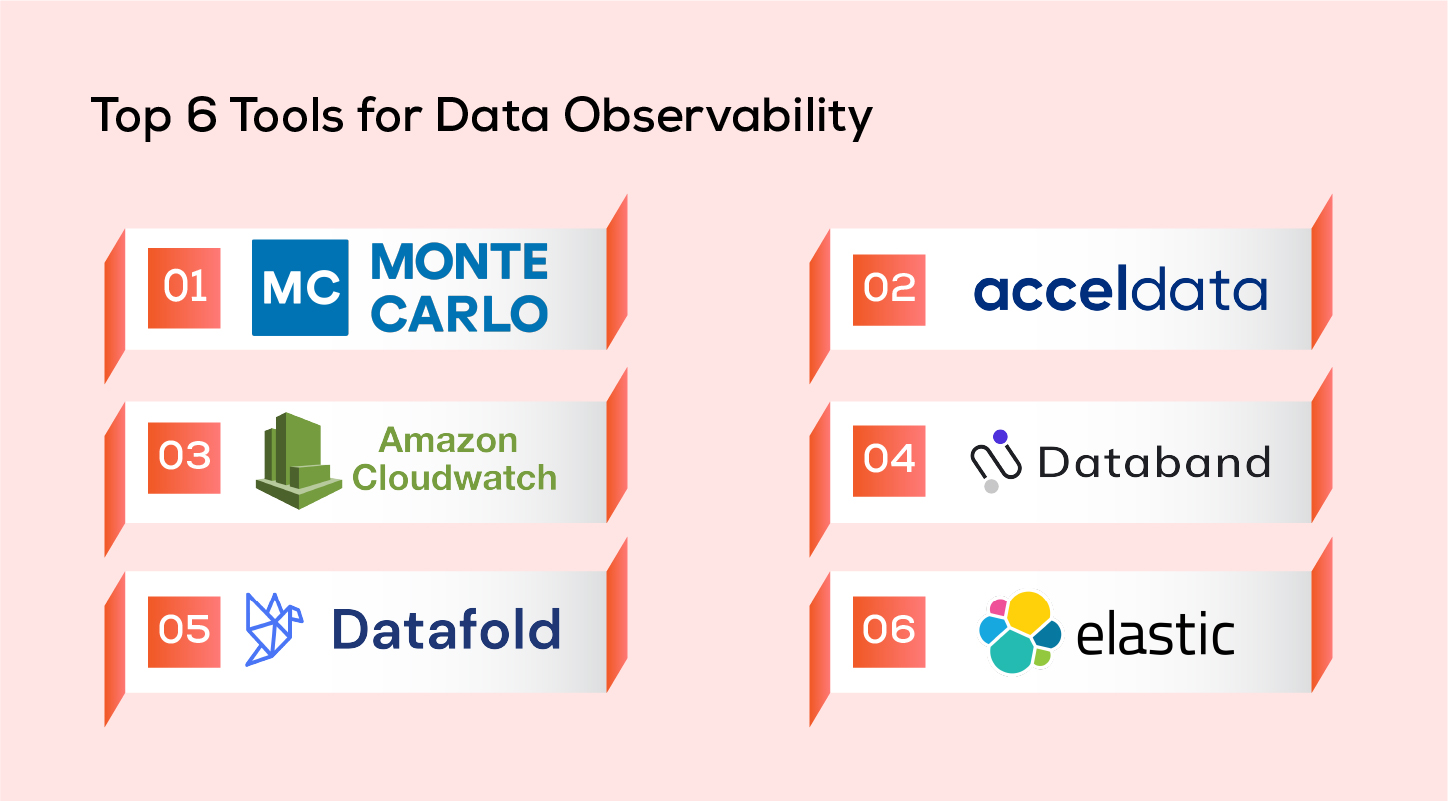
Top 6 Tools for Data Observability
-
Machine Learning Observability (Full-stack visibility inside training model)
Machine learning capability examines the performance of models, measuring how well they can predict the systems. Machine learning engineers and data scientists employ ML observability to gain a deeper understanding of the model's evolution throughout its development stages.
Key Components of ML Observability
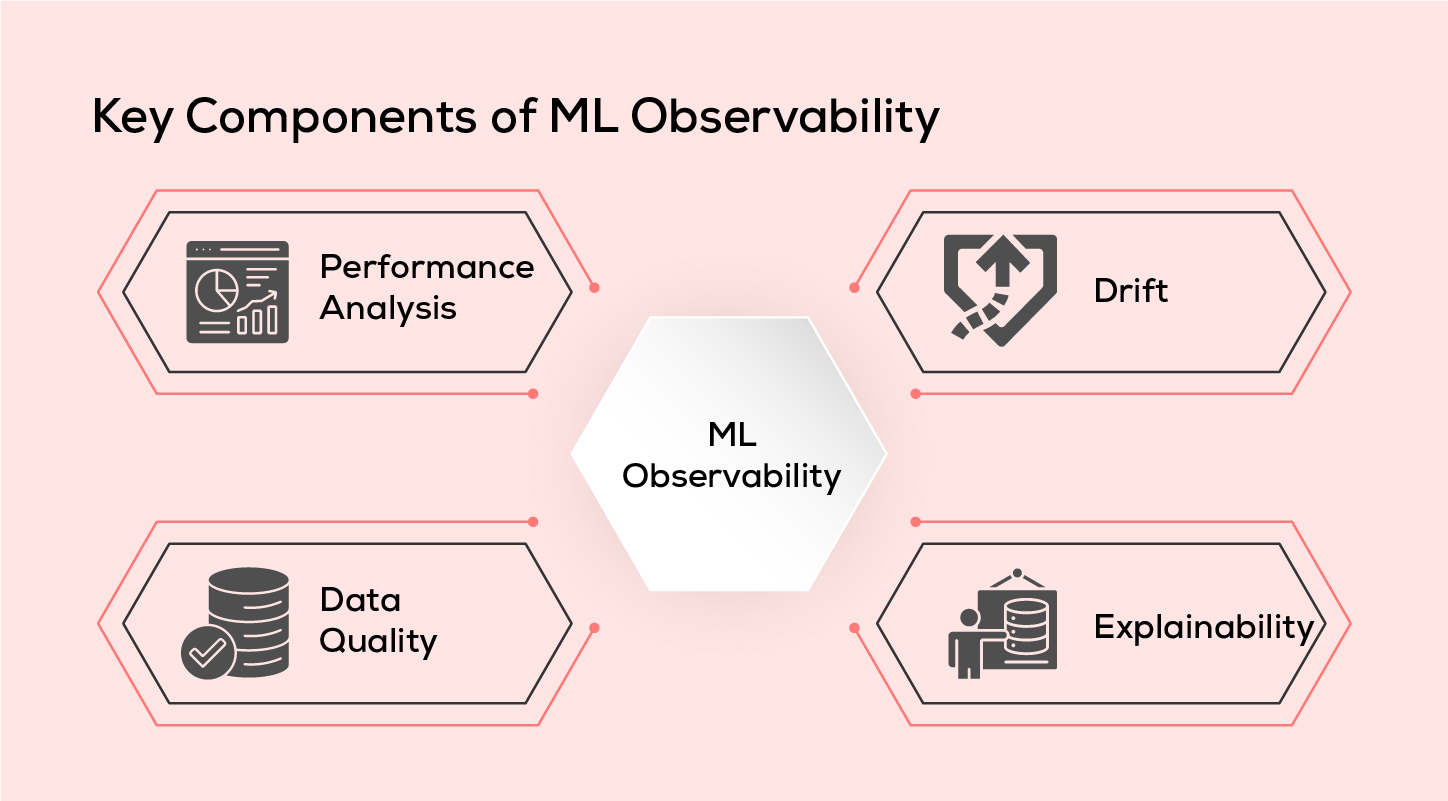
Performance Analysis:
Consistency in performance is vital. Therefore, this aspect ensures that the performance of machine learning models remain consistent. It assesses whether the model's performance in real-world deployment or usage aligns with its behaviour during the training phase.
Drift:
Drift detection helps determine whether a machine learning model is still valid and relevant. It identifies changes in the data distribution, indicating if the model has become "stale" or if data quality issues or adversarial inputs are affecting its performance. Detecting drift is crucial for safeguarding the model from degradation and ensuring it remains reliable.
Data Quality:
Data quality focuses on identifying issues within the data pipelines, specifically between the training and production phases. It aims to catch issues like missing data or data type mismatches, which can have a detrimental impact on system performance. Monitoring data quality is essential for maintaining the integrity of the model's input data.
Explainability:
It reveals the features used during training, validation, and production that elucidate the model's behaviour. Measuring this can be done through the calculation of metrics such as SHAP and LIME.
Best Practices of ML Observability
- Incorporate ML observability from the experimental stage.
- Establish clear accountability for both data and models.
- Apply consistent monitoring approaches to both batch and streaming data for enhanced troubleshooting.
- Vigilantly monitor the accuracy of your predictions.
- Log all critical information pertaining to system performance.
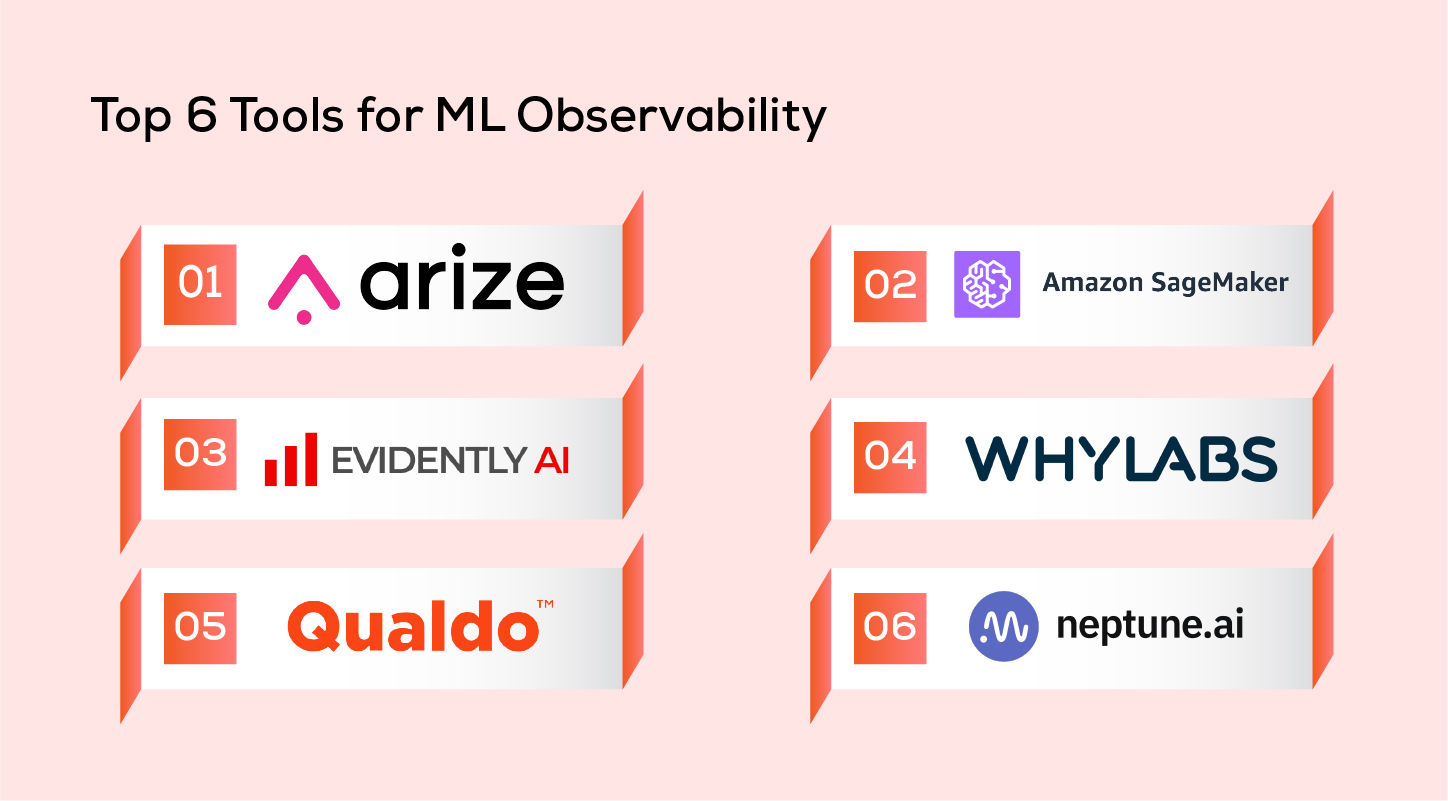
Top 6 Tools for ML Observability
Some Success Stories of Observability
-
Lenovo E-Commerce Achieved 100% Uptime and 80% MTTR Reduction Through Infrastructure Observability
- Lenovo, a multinational organization with a $50 billion value, creates smart devices and runs a strong e-commerce platform. In e-commerce, keeping the website available all the time is important because it affects how smoothly people can shop online. Lenovo used a tool for observing its digital infrastructure, which allowed their developers to see everything happening inside the system.
- This observability solution helped Lenovo's engineers react quickly when customers had problems. It made the troubleshooting process faster, reducing the time it takes to fix an issue from 30 minutes to just 5 minutes. With this solution, Lenovo made sure that no transactions were lost, the system didn't slow down, and everything happened in real-time. Even during busy shopping events like Black Friday and Cyber Monday, Lenovo's website stayed up the entire time, making sure that shoppers had a smooth and reliable experience.
-
Swiggy Delivers to Over 30 Million Users, Boosts Productivity by 10%
- Swiggy, a leading food delivery platform in India, with over 30 million users across 500+ cities, faced the challenge of optimizing operational efficiency and ensuring platform reliability. To maintain sustainable growth, they needed insights into the end-user experience. With observability, Swiggy's engineers gained the power to uncover customer insights within 15 minutes, proactively prevent outages, and optimize the user interface for an enhanced app experience.
-
PhonePe Achieves 65% Data Management Cost Reduction and 2000% Data Infrastructure Scaling through Data Observability
- PhonePe, a leading payment service provider in India, achieved a 65% reduction in data management costs and expanded its data infrastructure by 2000%. As they expanded, maintaining system performance became a challenge, resulting in downtime due to issues and root cause identification. PhonePe's complex OLTP and OLAP systems demanded a comprehensive solution.
- To address this, PhonePe adopted an end-to-end data observability solution, enabling them to monitor various pipelines and scale the data infrastructure from 70 to 1500 nodes. With accurate root cause analysis and automated alerts, they significantly reduced data management costs, supporting rapid and sustainable growth.
-
ShareChat Boosts ROI by 100% and Slashes Error Detection Time
- ShareChat, a rapidly growing social media platform with 400 million monthly users, grappled with managing over 100 machine learning models in areas like advertising, feed management, and content intelligence. This extensive model oversight consumed a significant portion of the organization's resources, especially in terms of monitoring and issue resolution. ShareChat responded by adopting ML observability.
- Implementing ML observability significantly slashed error detection time from 24 hours to just minutes, freeing up hundreds of productive hours and reducing operational costs. This shift allowed ShareChat to invest these reclaimed hours into more productive activities, resulting in an impressive 100% ROI increase.
-
Braze Achieves 90% Processing Time Reduction and Operational Excellence
- Braze, a U.S.-based CRM software company, achieved an impressive 90% reduction in processing time, a significant feat considering their daily handling of 8 billion API requests. As they expanded their operations and business, they encountered challenges related to scaling, debugging incidents, and responding promptly to customer support issues. The complexities grew as customer support tickets were directly funneled to product and DevOps teams, impacting overall productivity and efficiency. The absence of a centralized platform hindered the involvement of the customer success team, responsible for swiftly addressing customer issues.
- To address these multifaceted challenges, Braze made the strategic shift to observability. This observability solution played a pivotal role in identifying potential problems, understanding user interactions, and pinpointing customer pain points. The data collected empowered the customer success team to expedite issue resolution, leading to improved customer satisfaction. Simultaneously, as performance-related issues were addressed, Braze bolstered application availability, and their engineering team scaled the infrastructure seamlessly, free from production concerns. Ultimately, the adoption of a unified platform, replacing multiple tools, resulted in a remarkable 90% reduction in processing time, solidifying Braze's commitment to operational efficiency and exceptional service.
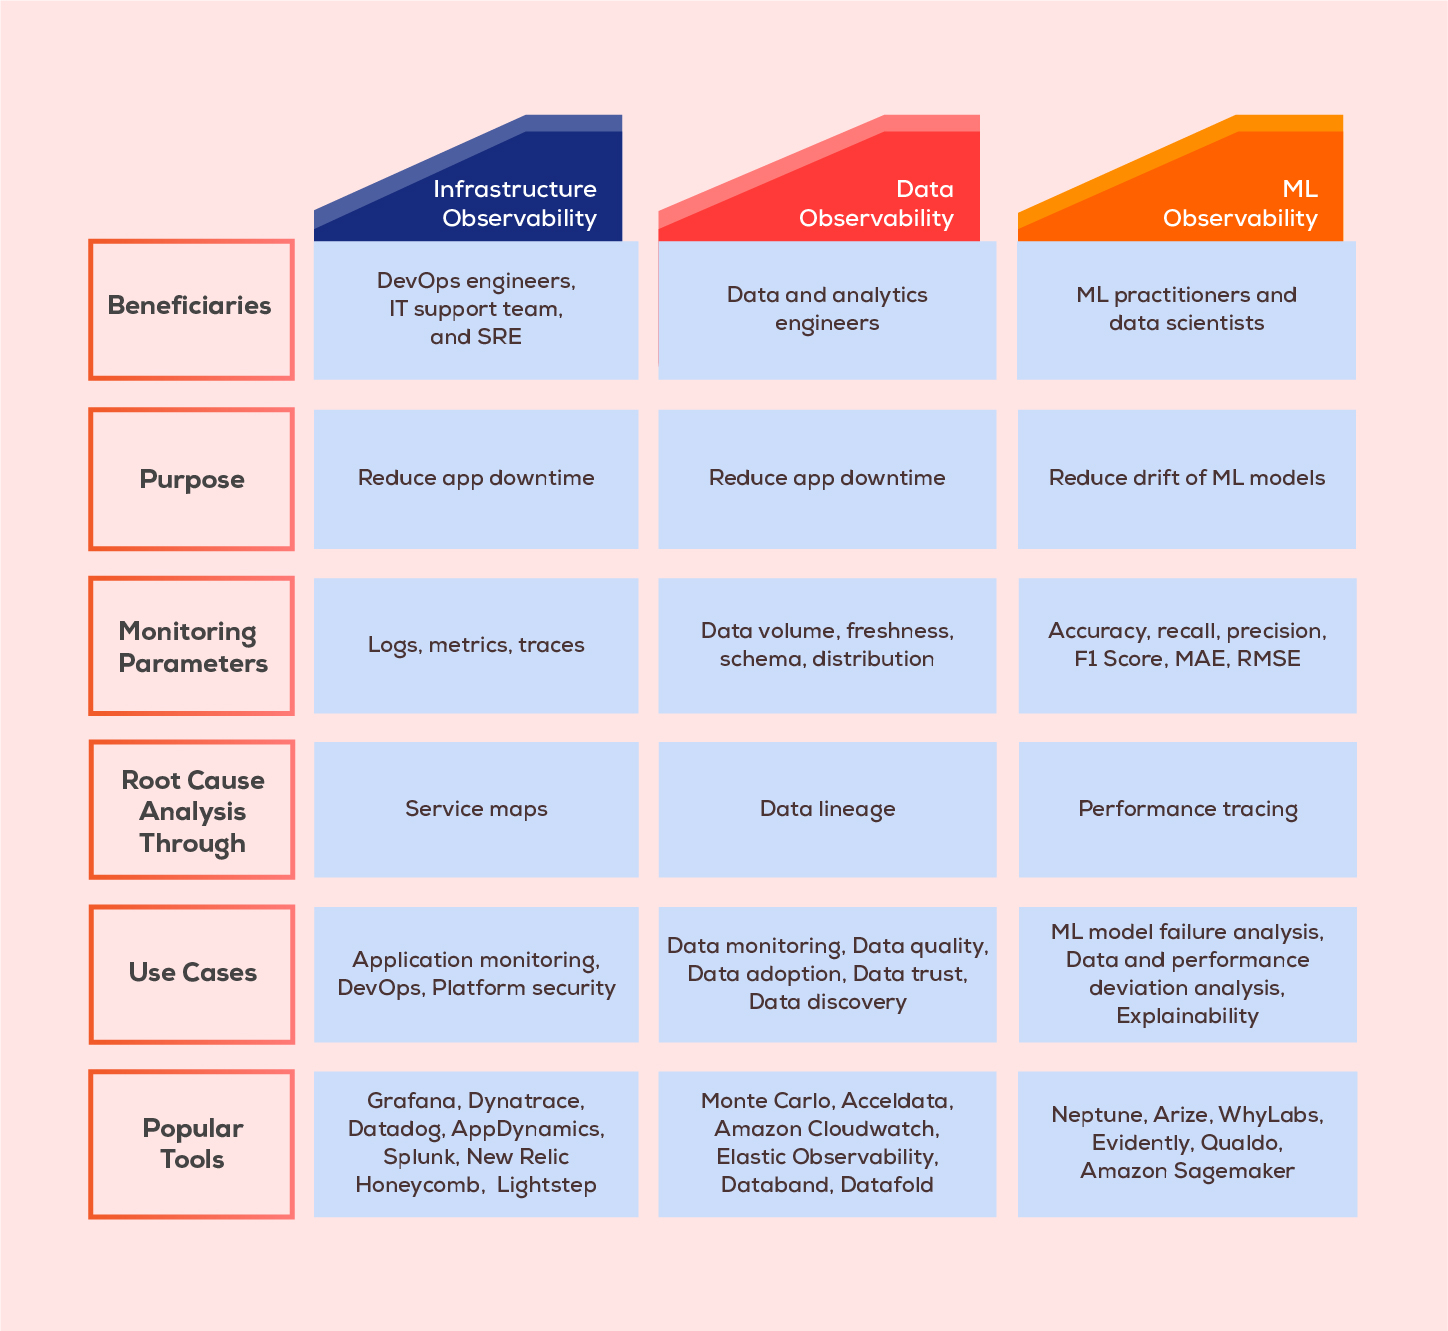
Infrastructure Vs. Data Vs. Machine Learning Observability
Conclusion
In the ever-evolving world of IT systems and data environments, observability emerges as the secret sauce that fuels reliability, performance, and efficiency. It's like having a superpower that lets organizations monitor, troubleshoot, and optimize their operations with ease. From keeping a watchful eye on infrastructure and systems to diving deep into data and machine learning, observability equips teams to stay one step ahead, fix issues before they escalate, and keep the data flowing smoothly. In a landscape where success hinges on uptime, ROI, and scalability, observability is the guiding light that empowers organizations to make smarter decisions, streamline processes, and deliver exceptional experiences. It's the compass that leads the way to operational excellence and unrivaled service delivery in this data-driven era.
Frequently Asked Questions
1. What's the difference between monitoring and observability?
Monitoring focuses on tracking predefined metrics to provide insight into a system's current state and detect known issues. It is limited in scope and often used for routine maintenance and alerting. Whereas, observability is a broader approach that involves various data sources, allowing a deeper understanding of complex systems. It is proactive, facilitates troubleshooting, and is particularly valuable for exploring unforeseen issues in dynamic environments. It goes beyond predefined boundaries to offer a holistic view of system behavior.
2. What is monitoring in DevOps?
DevOps monitoring involves observing and assessing the performance and condition of systems and applications to promptly identify and resolve issues. It involves collecting data on various aspects like CPU usage, disk space, and application response times. By following DevOps monitoring best practices, teams can proactively detect and address problems, mitigating the risk of outages or service degradation.
3. How is observability related to cloud native?
In cloud-native applications, observability is vital because they rely on microservices, which are like building blocks of the software. Observability helps see how these building blocks work together. These apps often use containers to run the software, where tools like Kubernetes manage these containers. Observability data keeps an eye on how well these containers are doing and how the system's resources are used. It helps make sure the app works well and also helps in making it more efficient and cost-effective in the long run, which benefits the users.
4. What are the 3 pillars of observability?
The foundation of observability rests upon three pillars: logs, metrics, and traces. These three types of data outputs offer unique perspectives on the status and operations of systems within cloud and microservices environments.
5. Why do we need observability?
Observability accelerates developers' ability to identify and rectify issues swiftly, offering enhanced visibility that enables them to promptly detect system changes, troubleshoot problems, and assess the impacts of these modifications.